


Report: Which States Have Highest Pedestrian Fatality Rates?
Last year in the United States alone, more than 4700 people were involved in fatal auto-pedestrian accidents. While that number is staggering, it represents a gradual downward trend over the last two decades.
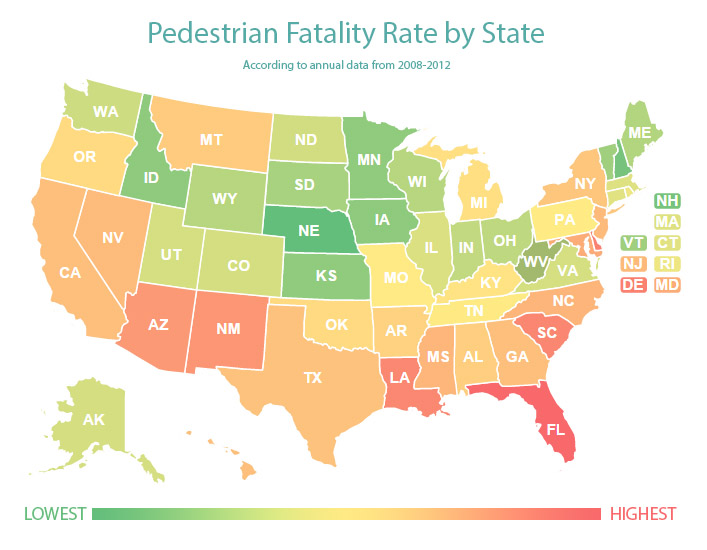
With Halloween (the deadliest day for pedestrians) coming up, we wanted to dive deeper into the statistics and look at where and when auto-pedestrian accidents are most likely to occur. Using cumulative data (from the NHTSA’s Fatality Analysis Reporting System [FARS]) for the last 5 years, we created the above map — a visualization of where the highest fatality rates* exist across the United States.
The following states have a pedestrian fatality rate higher than the national average, Florida being the highest [click here to see data for all states]:
2. Delaware — 11.23
3. South Carolina — 10.92
4. Louisiana — 10.87
5. New Mexico — 10.12
6. Arizona — 9.96
7. Maryland — 9.01
8. North Carolina — 8.54
9. Mississippi — 8.48
10. New Jersey — 8.24
12. California — 7.97
13. Hawaii — 7.97
14. Texas — 7.82
15. Georgia — 7.7
16. New York — 7.62
17. Montana — 7.36
18. Alabama — 7.24
19. Arkansas — 6.99
———————————————————————————————————————————————————————
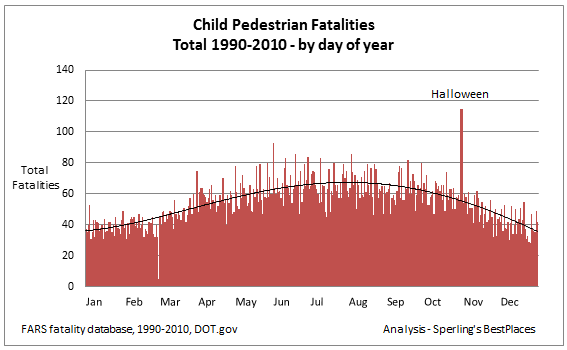
Child Pedestrian Deaths More Likely on Halloween
The summer months tend to be the most dangerous for children, with Halloween as the clear exception. See our Halloween Safety Tips for ways to keep your kids safe this Hallow’s Eve.
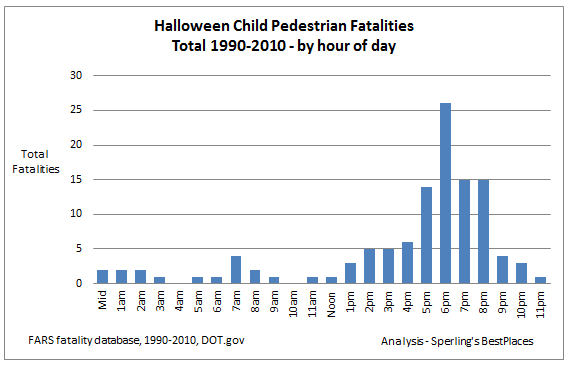
Most child pedestrian fatalities occur between 5PM and 8PM, peak hours for trick or treating.
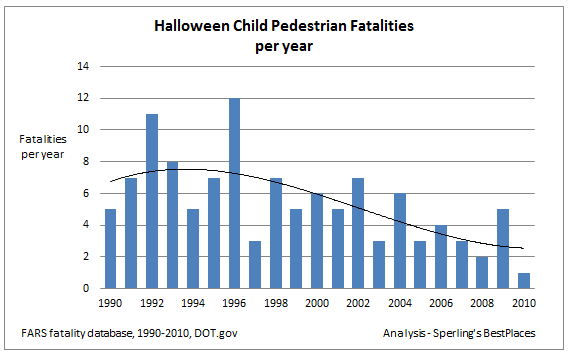
Halloween child pedestrian fatalities are trending downward year over year.
Complete Data for All 50 States
.tg {border-collapse:collapse;border-spacing:0;}
.tg td{font-family:Arial, sans-serif;font-size:14px;padding:10px 5px;border-style:solid;border-width:1px;overflow:hidden;word-break:normal;}
.tg th{font-family:Arial, sans-serif;font-size:14px;font-weight:normal;padding:10px 5px;border-style:solid;border-width:1px;overflow:hidden;word-break:normal;}
.tg .tg-lv7t{background-color:#fdba7b;text-align:center}
.tg .tg-cza1{background-color:#8eca7d;text-align:center}
.tg .tg-34fl{background-color:#b2d57f;text-align:center}
.tg .tg-rayv{background-color:#d1dd81;text-align:center}
.tg .tg-zwre{background-color:#cddc81;text-align:center}
.tg .tg-qya1{background-color:#ece582;text-align:center}
.tg .tg-1fi5{background-color:#c2d980;text-align:center}
.tg .tg-a1ao{background-color:#bed880;text-align:center}
.tg .tg-ro1j{background-color:#b7d67f;text-align:center}
.tg .tg-xagh{background-color:#fece7f;text-align:center}
.tg .tg-v0st{background-color:#eee683;text-align:center}
.tg .tg-b00d{background-color:#d5df81;text-align:center}
.tg .tg-s6z2{text-align:center}
.tg .tg-0jyy{background-color:#8fca7d;text-align:center}
.tg .tg-o2sh{background-color:#a0cf7e;text-align:center}
.tg .tg-4lca{background-color:#fdbb7b;text-align:center}
.tg .tg-l2cj{background-color:#dbe081;text-align:center}
.tg .tg-g4ar{font-weight:bold;background-color:#dcf6ec;color:#000000;text-align:center}
.tg .tg-gj2s{background-color:#e1e282;text-align:center}
.tg .tg-zjo5{background-color:#fa8771;text-align:center}
.tg .tg-pumt{background-color:#a8d27f;text-align:center}
.tg .tg-8qxe{background-color:#dcf6ec;color:#000000;text-align:center}
.tg .tg-drnj{background-color:#fdc67d;text-align:center}
.tg .tg-w1nd{background-color:#ffea84;text-align:center}
.tg .tg-p1vy{background-color:#fa8170;text-align:center}
.tg .tg-ex4r{background-color:#fdc27d;text-align:center}
.tg .tg-cpk8{background-color:#dee182;text-align:center}
.tg .tg-046s{background-color:#63be7b;text-align:center}
.tg .tg-snab{background-color:#77c37c;text-align:center}
.tg .tg-6rwc{background-color:#90cb7d;text-align:center}
.tg .tg-vat1{background-color:#d4de81;text-align:center}
.tg .tg-7q44{background-color:#d5de81;text-align:center}
.tg .tg-5s15{background-color:#feea83;text-align:center}
.tg .tg-pa7a{background-color:#ffeb84;text-align:center}
.tg .tg-b1au{background-color:#ffe383;text-align:center}
.tg .tg-qzpf{background-color:#ffdf82;text-align:center}
.tg .tg-ird5{background-color:#ffda81;text-align:center}
.tg .tg-s35m{background-color:#fed280;text-align:center}
.tg .tg-x2xf{background-color:#fecb7e;text-align:center}
.tg .tg-md4h{background-color:#fdbf7c;text-align:center}
.tg .tg-11cz{background-color:#fdb67a;text-align:center}
.tg .tg-jrhg{background-color:#fdb57a;text-align:center}
.tg .tg-lpa7{background-color:#fcac78;text-align:center}
.tg .tg-qhc5{background-color:#fb9975;text-align:center}
.tg .tg-kuq1{background-color:#fb9674;text-align:center}
.tg .tg-ls6i{background-color:#fa8871;text-align:center}
.tg .tg-tim6{background-color:#f8696b;text-align:center}
| Annual Pedestrian Fatalities | |||||||||
|---|---|---|---|---|---|---|---|---|---|
| RANK | STATE | POPULATION | 2008 | 2009 | 2010 | 2011 | 2012 | 5-YR SUM | RATE |
| 1st | Nebraska | 1,855,525 | 5 | 9 | 8 | 7 | 15 | 44 | 2.37 |
| 2nd | New Hampshire | 1,320,718 | 7 | 8 | 9 | 5 | 8 | 37 | 2.8 |
| 3rd | Iowa | 3,074,186 | 17 | 21 | 18 | 25 | 20 | 101 | 3.29 |
| 4th | Idaho | 1,595,728 | 11 | 10 | 10 | 9 | 13 | 53 | 3.32 |
| 5th | Kansas | 2,885,905 | 19 | 22 | 15 | 14 | 26 | 96 | 3.33 |
| 6th | Minnesota | 5,379,139 | 25 | 42 | 35 | 39 | 38 | 179 | 3.33 |
| 7th | Vermont | 626,011 | 1 | 5 | 4 | 3 | 10 | 23 | 3.67 |
| 8th | South Dakota | 833,354 | 10 | 4 | 9 | 7 | 2 | 32 | 3.84 |
| 9th | Maine | 1,329,192 | 12 | 11 | 12 | 10 | 9 | 54 | 4.06 |
| 10th | Wyoming | 576,412 | 7 | 2 | 3 | 6 | 6 | 24 | 4.16 |
| 11th | Wisconsin | 5,726,398 | 53 | 38 | 52 | 57 | 45 | 245 | 4.28 |
| 12th | Ohio | 11,544,225 | 99 | 85 | 93 | 104 | 115 | 496 | 4.3 |
| 13th | Indiana | 6,537,334 | 54 | 50 | 62 | 62 | 59 | 287 | 4.39 |
| 14th | Washington | 6,897,012 | 63 | 59 | 61 | 64 | 72 | 319 | 4.63 |
| 15th | North Dakota | 699,628 | 6 | 4 | 7 | 9 | 7 | 33 | 4.72 |
| 16th | Colorado | 5,187,582 | 43 | 47 | 36 | 45 | 76 | 247 | 4.76 |
| 17th | Alaska | 731,449 | 3 | 9 | 6 | 9 | 8 | 35 | 4.79 |
| 18th | Utah | 2,855,287 | 32 | 19 | 28 | 30 | 28 | 137 | 4.8 |
| 19th | Virginia | 8,185,867 | 75 | 74 | 73 | 73 | 98 | 393 | 4.8 |
| 20th | Illinois | 12,875,255 | 135 | 112 | 115 | 134 | 138 | 634 | 4.92 |
| 21st | Massachusetts | 6,646,144 | 76 | 46 | 68 | 69 | 72 | 331 | 4.98 |
| 22nd | Connecticut | 3,590,347 | 47 | 26 | 46 | 26 | 36 | 181 | 5.04 |
| 23rd | West Virginia | 1,855,413 | 13 | 21 | 13 | 20 | 31 | 98 | 5.28 |
| 24th | Rhode Island | 1,050,292 | 12 | 16 | 9 | 14 | 5 | 56 | 5.33 |
| 25th | Tennessee | 6,456,243 | 60 | 71 | 87 | 80 | 67 | 365 | 5.65 |
| 26th | Pennsylvania | 12,763,536 | 137 | 134 | 145 | 147 | 163 | 726 | 5.69 |
| 27th | Missouri | 6,021,988 | 63 | 68 | 55 | 75 | 84 | 345 | 5.73 |
| 28th | Kentucky | 4,380,415 | 66 | 41 | 61 | 50 | 49 | 267 | 6.1 |
| 29th | Michigan | 9,883,360 | 114 | 118 | 128 | 138 | 129 | 627 | 6.34 |
| 30th | Oregon | 3,899,353 | 51 | 48 | 56 | 46 | 55 | 256 | 6.57 |
| 31st | Oklahoma | 3,814,820 | 50 | 32 | 62 | 43 | 65 | 252 | 6.61 |
| — | USA | 318,833,000 | 4414 | 4109 | 4302 | 4457 | 4743 | 22025 | 6.91 |
| 32nd | Arkansas | 2,949,131 | 45 | 37 | 38 | 42 | 44 | 206 | 6.99 |
| 33rd | Alabama | 4,822,023 | 68 | 64 | 61 | 79 | 77 | 349 | 7.24 |
| 34th | Montana | 1,005,141 | 11 | 15 | 8 | 15 | 25 | 74 | 7.36 |
| 35th | New York | 19,570,261 | 297 | 308 | 303 | 287 | 297 | 1492 | 7.62 |
| 36th | Georgia | 9,919,945 | 147 | 152 | 168 | 130 | 167 | 764 | 7.7 |
| 37th | Texas | 26,059,203 | 435 | 350 | 349 | 425 | 478 | 2037 | 7.82 |
| 38th | Hawaii | 1,392,313 | 20 | 16 | 26 | 23 | 26 | 111 | 7.97 |
| 39th | California | 38,041,430 | 620 | 567 | 601 | 633 | 612 | 3033 | 7.97 |
| 40th | Nevada | 2,758,931 | 56 | 35 | 36 | 46 | 54 | 227 | 8.23 |
| 41st | New Jersey | 8,864,590 | 135 | 158 | 139 | 142 | 156 | 730 | 8.24 |
| 42nd | Mississippi | 2,984,926 | 50 | 58 | 50 | 47 | 48 | 253 | 8.48 |
| 43rd | North Carolina | 9,752,073 | 160 | 146 | 169 | 161 | 197 | 833 | 8.54 |
| 44th | Maryland | 5,884,563 | 116 | 114 | 102 | 102 | 96 | 530 | 9.01 |
| 45th | Arizona | 6,553,255 | 121 | 118 | 145 | 147 | 122 | 653 | 9.96 |
| 46th | New Mexico | 2,085,538 | 39 | 39 | 33 | 39 | 61 | 211 | 10.12 |
| 47th | Louisiana | 4,601,893 | 107 | 108 | 77 | 90 | 118 | 500 | 10.87 |
| 48th | South Carolina | 4,723,723 | 101 | 89 | 90 | 113 | 123 | 516 | 10.92 |
| 49th | Delaware | 917,092 | 21 | 15 | 22 | 18 | 27 | 103 | 11.23 |
| 50th | Florida | 19,317,568 | 490 | 467 | 486 | 490 | 476 | 2409 | 12.47 |
*Methodology: Pedestrian fatality rate (deaths per 100K state residents) was determined by totaling the last 5 years (2008-2012) of deaths by state, multiplying by 100,000, then dividing by the population of the state. Data sourced from the FATALITY ANALYSIS REPORTING SYSTEM (FARS). Information on traffic fatalities is available from the National Center for Statistics and Analysis (NCSA), NVS-424, 1200 New Jersey Avenue SE., Washington, DC 20590. NCSA can be contacted at 800-934-8517 or via the following e-mail address: [email protected]. General information on highway traffic safety can be accessed by Internet users at www.nhtsa.gov/NCSA.
Free Insurance Comparison
Enter your zip code below to view companies that have cheap insurance rates.