


MAP: Are Republicans Worse Drivers Than Democrats?
Proof that Republicans are horrible drivers? Coincidence? Let’s take a look.
Why do Romney states fare so poorly?
When it comes to overall traffic safety, many factors come into play; weather conditions, average age of drivers, driving distractions, average miles traveled per driver and road conditions to name a few.
That red and blue 2012 election results map is forever ingrained in my memory; it was the last thing I looked at before realizing that Romney had lost and I’d need to start searching for a new job.
That was nearly two years ago, though I still weep nightly. These days, I have the pleasure of combing through insurance data for Obrella. Interestingly, while putting together a report on driving safety a few weeks ago, I noticed a pretty glaring correlation: [tweetherder text=”A majority of states with high traffic fatality rates went for Romney in 2012.”]the large majority of states with above average traffic fatality rates went for Romney in 2012.[/tweetherder]
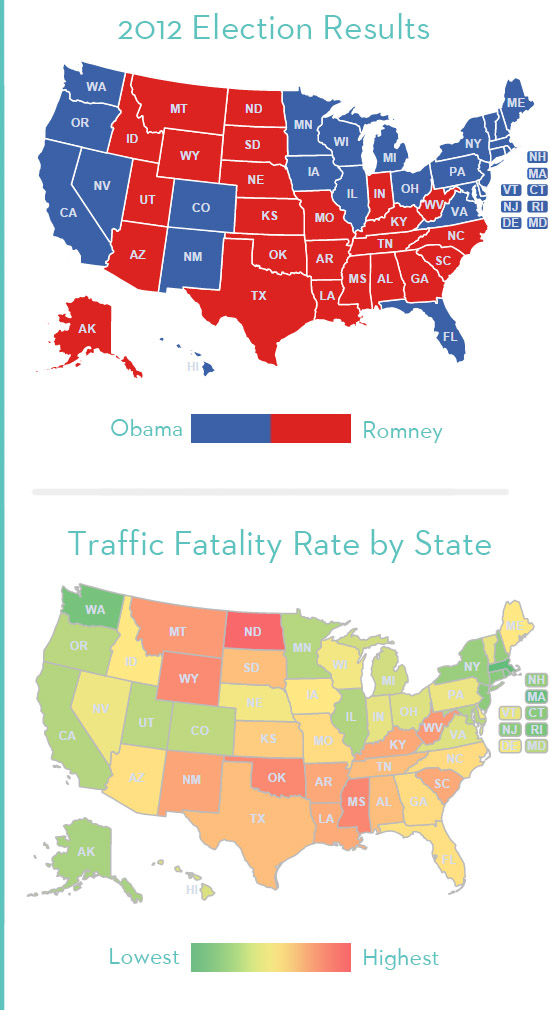
In this instance, because we’re looking at the rate of traffic fatalities per 100K licensed drivers*, it’s easy to see how traffic patterns might skew the data. For example, North Dakota and Wyoming have relatively low population but a lot of “drive through” traffic, resulting in an abnormally high fatality rate. On the other hand, highly populated coastal states like Massachusetts and New Jersey — with far fewer miles of highway and a greater adoption of public transit — come out with a seemingly better rate.
Much could be said about why the such a stark correlation exists, and this is just one observation that we find intriguing. Share your observations and reasoning with us in the comments section – we’d love to hear them!
Correlation doesn’t imply causation.
While it could be said that [tweetherder text=”You’re more likely to be involved in a fatal accident while driving in a state that voted for Romney.”]you’re more likely to be involved in a fatal accident while driving in a state that voted for Romney[/tweetherder], I don’t think it’s accurate — based on this data, at least — to say that Republicans are worse drivers than Democrats. What we have here is a classic example of correlation vs. causation.
Understanding the difference between correlation and causation can help you become a better consumer of data. Next time you see a flashy headline asserting something crazy like “Republicans are Worse Drivers than Democrats”, dive into the data. You may be surprised to find just how many people manipulate data and ignore the differences between correlation and causation. (For more information, read our “Democrats vs. Republicans: Who Are Worse Drivers?“).
Election Results vs. Traffic Fatality Rate – Complete Data for All 50 States
Explore the complete data below and let us know if you see any other interesting patterns or correlations.
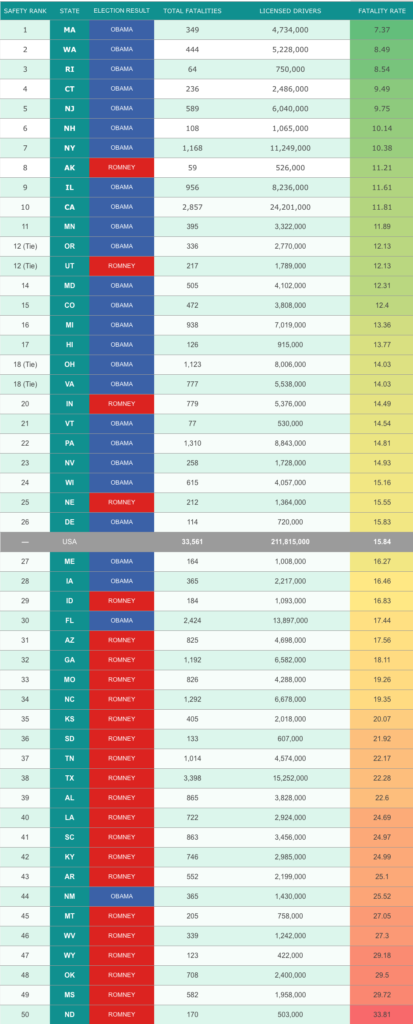
*Methodology: Rankings were determined by fatality rate per 100 thousand licensed drivers. Data sourced from the National Highway Traffic Safety Administration‘s “Traffic Safety Facts” Report, released in June 2014. Information on traffic fatalities is available from the National Center for Statistics and Analysis (NCSA), NVS-424, 1200 New Jersey Avenue SE., Washington, DC 20590. NCSA can be contacted at 800-934-8517 or via the following e-mail address: [email protected]. General information on highway traffic safety can be accessed by Internet users at www.nhtsa.gov/NCSA.
Free Insurance Comparison
Enter your zip code below to view companies that have cheap insurance rates.
![]() Secured with SHA-256 Encryption
Secured with SHA-256 Encryption